Omni Insights
The Hidden Patterns in
Employee
Attrition
What ~30,000+ Employee Records Reveal
About Retention


Attrition isn't random; it follows predictable patterns that give HR teams early signals to act on. For the first time ever, Omni is revealing insights based on data from across our user base. This analysis, based on roughly 30,000 anonymized employee records from ~300 companies, uncovers when, why, and how employees leave.
The patterns that matter most:
1.
Early Tenure is Critical
One in three employees exits within their first year, with months 3-6 proving just as risky as the first 90 days.
2.
Instability Predicts Exits
Manager changes and unpaid leave are stronger red flags than compensation stagnation
3.
Revenue teams need targeted support
Front-office roles show 5-8 percentage points higher attrition at every milestone compared to back-office teams.
4.
Consistent Recognition Outperforms One-Time Raises
Multiple pay touchpoints throughout the year associate with lower exit risk than single annual adjustments.
5.
PTO Patterns Reveal Engagement
People who take regular paid time off are less likely to leave—but unpaid leave nearly doubles among those who exit.
If there's one thing this data makes clear, it's that retention happens long before someone hands in their notice. The patterns point to something more fundamental: people stay when their day-to-day reality—stable managers, consistent recognition, the breathing room to actually take time off—matches what they signed up for.

About This Analysis
This research examined a sample of roughly 30,000 anonymized employee records from ~300 companies using Omni HR. This dataset represents a segment of our customer base where event history was sufficiently complete to identify meaningful patterns.
The sample includes:
- Approximately 60% active employees and 40% terminated employees
- Geographic diversity: Malaysia (20.9%), Singapore (17.0%), Philippines (11.4%), Indonesia (6.2%), Vietnam (4.8%), Thailand (4.7%), Hong Kong (3.9%), and other markets
- Exclusion of Outliers: Data from enterprise-scale organizations or those with highly customized data schemas were excluded to maintain a consistent “Industry Benchmark” profile.
Team structure: We simplified roles into two categories for pattern recognition—Front Office (Sales, Marketing, Customer Success, Support) representing 23.3% of the dataset, and Back Office (Product, Engineering, HR, Finance, Operations) representing 76.7%.

Early Tenure: The First Year is Your Highest-Risk Window
The Reality: One in Three Employees Exits Within 12 Months
Here's what the data revealed about attrition timing:
- By 3 months: 11.3% have exited
- By 6 months: 21.2% have exited
- By 12 months: 33.2% have exited
- By 24 months: 50.2% have exited
These numbers tell a stark story. About four out of every ten exits (within 24 months) happen in the first six months. If you're concentrating your retention efforts on tenured employees, you're missing the critical window where most attrition occurs.
Months 3-6 Are Just As Risky As Months 0-3
Most companies obsess over the first 90 days. There's an entire industry built around onboarding—training programs, buddy systems, 30-60-90 day plans. But the data shows that risk doesn't drop after day 90.
Exit probability within each period:
Exit probability within each period:
- Months 0-3: 10.8% exit
- Months 3-6: 11.1% exit
The next quarter after onboarding is equally vulnerable. Your 6-month check-in might be more important than you think.
.avif)
Early Instability Compounds Over Time
Examining employees at the 6-month mark and measuring whether early signals predicted exits in the next 90 days revealed clear patterns:
Manager change in first 6 months:
16.0% exited vs 8.2% with stable manager
16%
Unpaid leave near month 6:
24.6% exited vs 10.5% without unpaid leave
24.6%
Pay adjustment near month 6:
6.2% exited vs 11.0% without pay event
6.2%
Stability matters. Employees who experience manager changes or financial strain (signaled by unpaid leave) in their first six months show significantly higher exit rates afterward. Interestingly, early pay adjustments associate with lower near-term exits—suggesting that responsive compensation may help stabilize new employees.
What this means: Extend your onboarding focus through month six, not just month three. Build stability into early tenure by minimizing manager changes during the first six months and monitoring unpaid leave as an early warning system.
What this means: Extend your onboarding focus through month six, not just month three. Build stability into early tenure by minimizing manager changes during the first six months and monitoring unpaid leave as an early warning system.
Download the full report
Team Type Matters: Revenue Roles Exit Faster
Front-Office Teams Show Consistently Higher Attrition
Not all roles carry the same attrition risk. Sales, customer success, and customer-facing positions consistently show higher exit rates at every milestone:
Milestone
Front office
Back office
6 months
23.6%
20.4%
12 months
37.6%
31.7%
24 months
56.0%
48.2%
That's a 5-8 percentage point difference at each stage. A company-wide retention strategy likely underserves your revenue teams—they need targeted support that addresses the unique pressures of customer-facing work.
What this means: Design targeted retention programs for front-office roles. Consider what makes these positions different—quota pressure, customer demands, commission structures, performance visibility—and address those factors directly rather than applying one-size-fits-all solutions.
What this means: Design targeted retention programs for front-office roles. Consider what makes these positions different—quota pressure, customer demands, commission structures, performance visibility—and address those factors directly rather than applying one-size-fits-all solutions.
Compensation: Consistency Beats Big Moments
Pay Helps—But Instability and Stress Overpower It
Looking at employees around the 12-month mark and measuring exits in the next 90 days:
- Pay increase near 12 months: 2.7% exit vs 7.1% without
- Manager change in first 12 months: 8.7% exit vs 6.6% without
- Unpaid leave near 12 months: 18.8% exit vs 6.6% without
Pay progress around annual reviews correlates with lower exits. But manager instability pushes risk up, and unpaid leave is a major stress signal—nearly three times higher exit risk.
The bottom line: pay helps, but manager instability and unpaid leave (a signal of financial strain) can overpower it.
The bottom line: pay helps, but manager instability and unpaid leave (a signal of financial strain) can overpower it.
A Raise Isn't Retention Insurance
Among employees who eventually quit and had compensation events:
- 28.3% exited within 90 days of their last pay event
- 15.4% exited within 60 days
- 5.5% exited within 30 days
Roughly one in four employees who left received a pay adjustment within three months before departing. This suggests either: raises came too late, raises weren't sufficient, or companies give raises reactively to retention risks.
A single raise isn't retention insurance, especially if it's reactive rather than part of consistent compensation progression.
A single raise isn't retention insurance, especially if it's reactive rather than part of consistent compensation progression.
Multiple Touchpoints Outperform Single Adjustments
Examining employees at 18 months and looking at pay events in the prior 12 months:
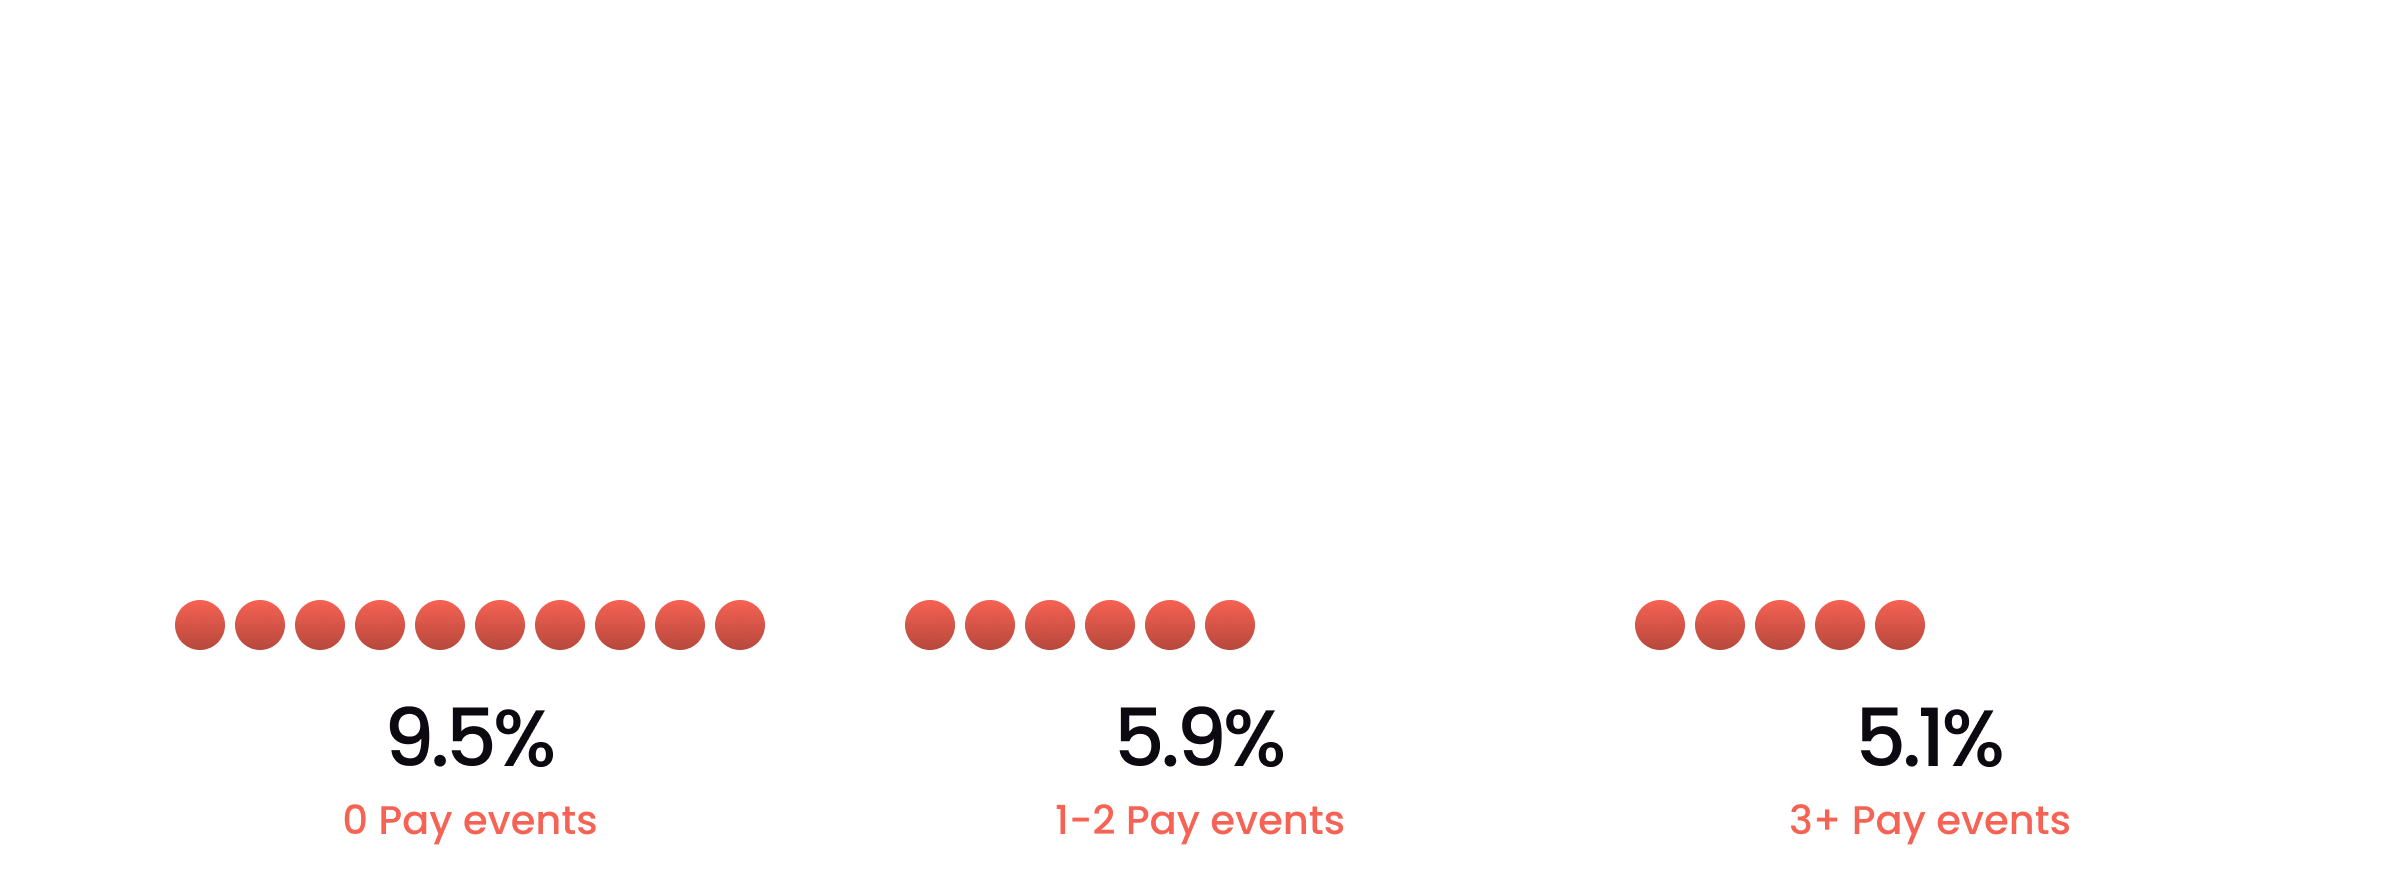
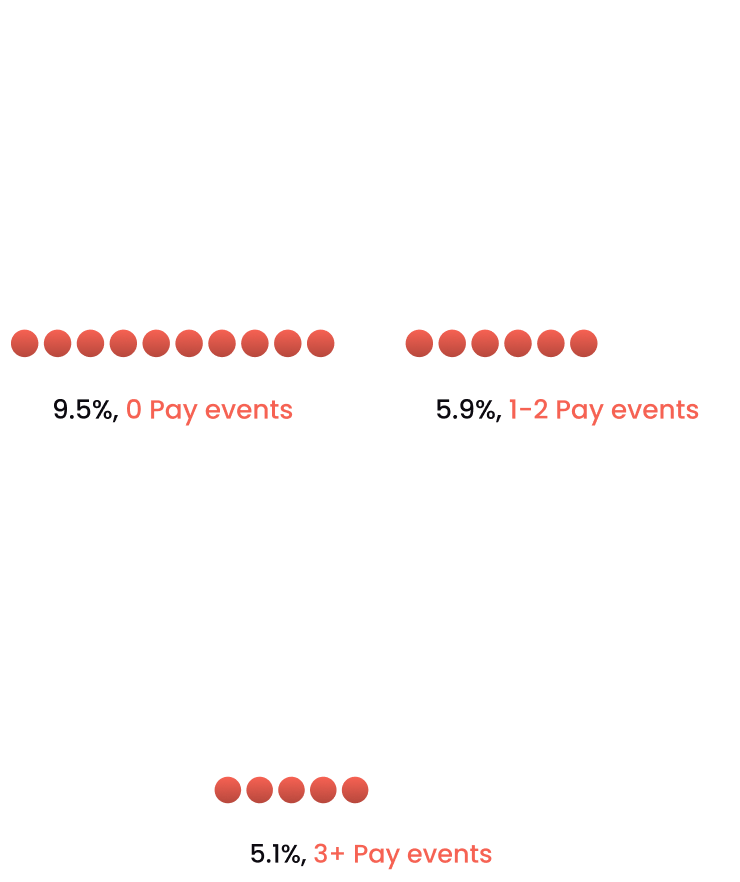
Multiple touchpoints throughout the year—regular increments, bonuses, adjustments—are associated with lower exit risk than a single annual event. Ongoing recognition and progression may outperform "one and done" raises.
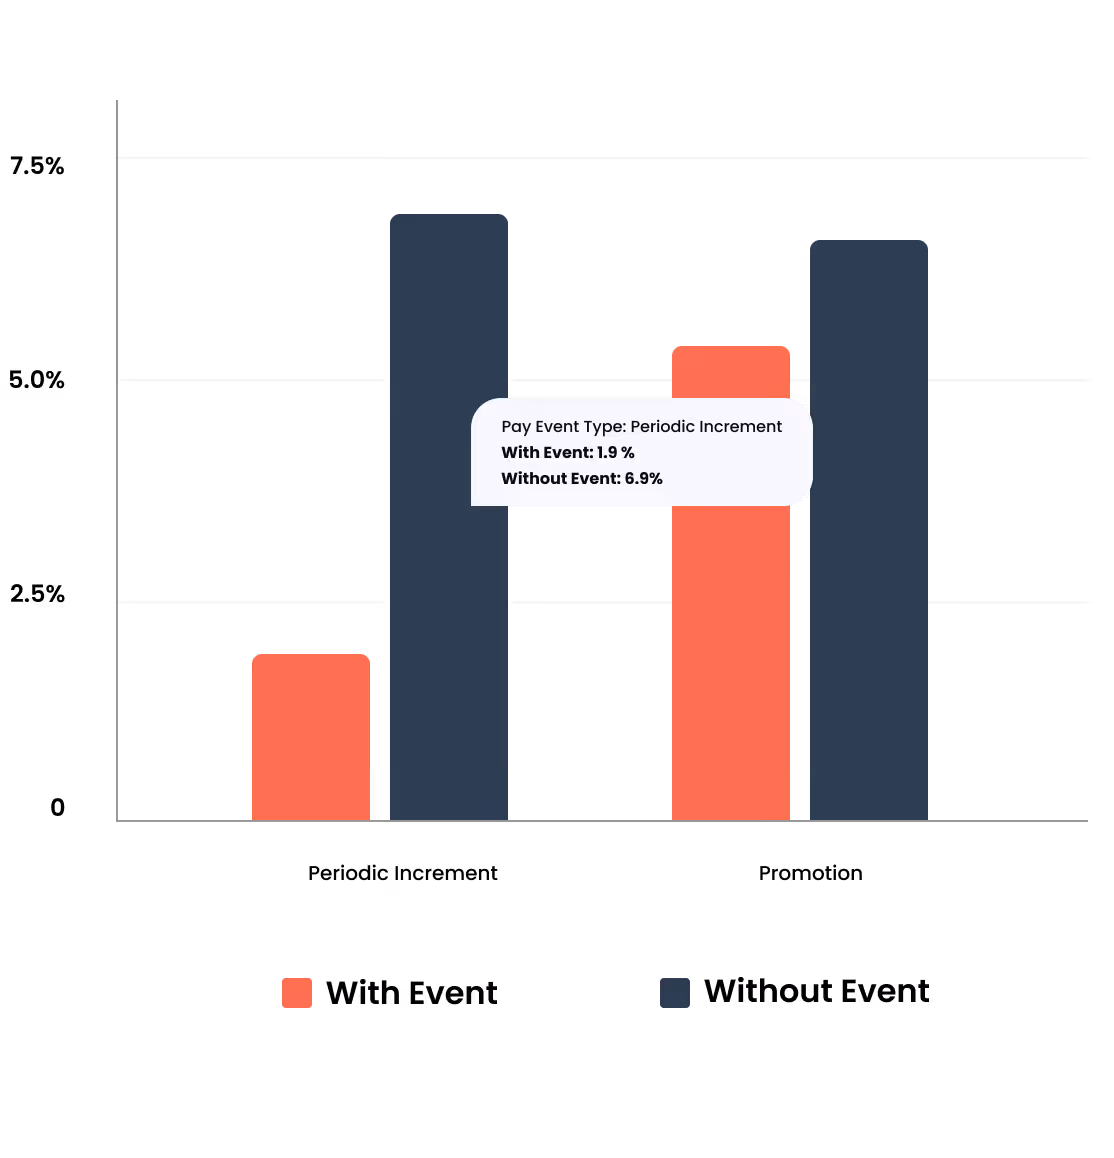
Periodic Increments May Matter More Than Promotions
Looking again at employees around the 12-month mark and exits in the next 90 days:
- Periodic increment near 12 months: ~1.9% exit vs ~6.9% without
- Promotion near 12 months: ~5.2% exit vs ~6.7% without
Both promotions and increments associate with lower near-term exits, but routine pay progression shows a stronger correlation. Employees want to feel forward momentum—sometimes that's about consistent recognition, not just a one-time promotion with a new title.
What this means: Implement regular compensation progression, not just annual reviews. Design systems that recognize employee growth quarterly or bi-annually. Focus on consistent forward momentum rather than single heroic moments.
What this means: Implement regular compensation progression, not just annual reviews. Design systems that recognize employee growth quarterly or bi-annually. Focus on consistent forward momentum rather than single heroic moments.
Time Off Tells a Story: PTO Predicts Retention
People Who Leave Take Less PTO (Except Unpaid Leave)
Looking at leave usage in the 90 days before an employee's exit or current status:
Leave Type
Employees Who Quit
Active Employees
Any leave
27.0%
34.3%
Paid leave
22.1%
31.8%
Unpaid leave
5.4%
2.9%
People who take regular PTO are less likely to leave, not more. But unpaid leave tells a different story—it nearly doubles among people who exit.
This could reflect workload, culture, policy friction, or disengagement. Either way, low PTO usage isn't a "healthy" sign. PTO usage isn't a warning sign—unpaid leave is.
What this means: Monitor unpaid leave as an early warning system. When employees take unpaid leave, dig deeper. Are they facing financial stress? Childcare issues? Medical concerns? Lack of PTO accrual? Each root cause requires a different intervention.
Manager Transitions Associate More With Firings Than Resignations
Evaluating termination data and measuring manager changes in the 90 days before exit:
- With recent manager change: 45.2% of exits were involuntary
- Without recent manager change: 26.0% of exits were involuntary
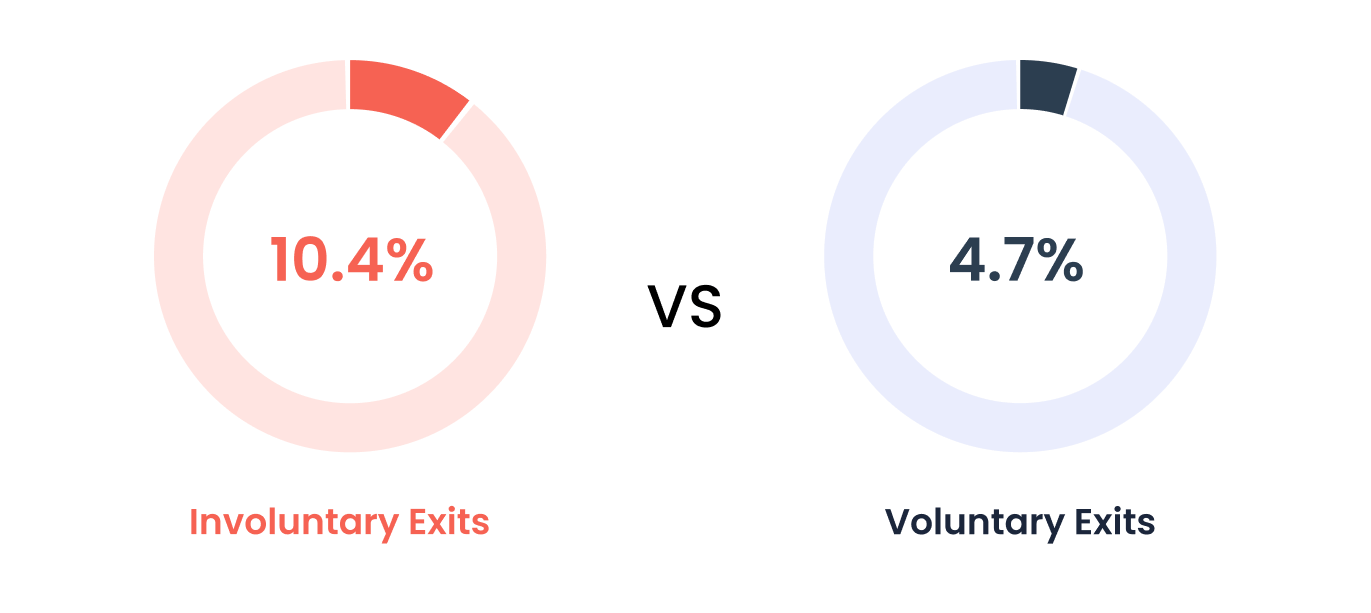
Also: Recent manager changes appear before 10.4% of involuntary exits vs 4.7% of voluntary exits.
Manager transitions don't just trigger resignations. In fact, they associate more strongly with involuntary exits.
What this means: Stabilize manager relationships during critical windows, especially the first six months. When manager changes are unavoidable, build transition protocols that clarify expectations, reset goals, and establish rapport quickly. Don't assume manager changes only drive voluntary attrition.
What This Means for Your Retention Strategy
These patterns suggest attrition isn't random. It clusters around:
- 1. Early tenure (first 6 months, especially months 3-6)
- 2. Organizational instability (manager changes)
- 3. Financial stress signals (unpaid leave)
- 4. Compensation stagnation (long gaps between pay events).
- 5. Team type (revenue-facing roles at higher risk)
Actionable Implications
01
Extend onboarding focus through month 6, not just month 3
The risk doesn't drop after 90 days. Build structured check-ins at month 6 and continue new-hire support through the first half-year.
02
Stabilize manager relationships during the first 6 months
Manager changes during early tenure significantly increase exit risk. When possible, avoid manager transitions during the first six months. When unavoidable, build robust handoff protocols.
03
Monitor unpaid leave as an early warning system
Unpaid leave is a stress signal that correlates with nearly 3X higher exit risk. When employees take unpaid leave, investigate the root cause and offer support.
04
Design targeted retention for front-office roles
Revenue-facing teams need specialized attention. Their higher attrition suggests that one-size-fits-all retention programs aren't sufficient.
05
Implement regular compensation progression, not just annual reviews
Multiple pay touchpoints throughout the year (increments, bonuses, adjustments) correlate with better retention than single annual events. Build systems that show consistent forward momentum.
06
Track paid leave usage—disengagement shows up as LESS PTO, not more
Low PTO usage isn't a sign of dedication, it's often a red flag. Encourage time off and track who isn't taking it.
Methodology & Limitations
This analysis identifies correlations, not causations. Multiple factors drive attrition—we've highlighted patterns that challenge common assumptions and deserve further investigation in your specific context.
01
Sample selection:
This research focused on companies where event data was sufficiently complete across the analysis period. Results reflect patterns within this sample and may not represent all Omni HR customers.
02
Geography and industry matter:
We simplified teams into Front Office vs Back Office for pattern recognition, but your specific industry and market will influence how these patterns show up in your data.
03
Data completeness varies:
Not every company uses every Omni HR module, so event coverage varies across the dataset. Some companies have rich compensation histories; others have more complete time-off tracking. We focused on patterns that emerged consistently across companies with complete data in each category.
Data Privacy & Governance
Responsible Use of Aggregated Data
At Omni, we believe workforce insights should strengthen organizational trust, not compromise it. This report is generated using fully anonymized and aggregated platform data across a diverse, multi-country customer base.
- Confidentiality by Design: No individual employee or organization-level data is disclosed. All analysis is performed on de-identified, aggregated datasets.
- Statistical Reliability: Results are only presented where sufficient sample sizes exist to ensure confidentiality and statistical reliability. No customer-level benchmarking or identifiable segmentation is included.
- Aggregate Correlations: The patterns presented — such as early-tenure risk windows or compensation momentum trends — reflect statistical correlations across the aggregate platform and do not represent any single organization’s internal data.
Contractual Framework
Omni HR operates as a data processor for our customers’ HR records. Omni may compile and publish aggregated statistical information derived from the use of our services, subject to the terms of each customer’s applicable agreement.
No personally identifiable information (PII) or company-specific operational data is disclosed in the research process.
No personally identifiable information (PII) or company-specific operational data is disclosed in the research process.
Turning Insights into Action
The detailed patterns of employee attrition are not just statistics; they are actionable signals. Omni HR provides the tools and visibility needed to translate these insights into proactive retention strategies, fostering a more stable and engaged workforce.


Discover how Omni HR can empower your organization to build stability, foster consistent momentum, and implement targeted retention strategies that make a difference.
Book a Demo
.avif)
“Our attrition has reduced by 20% since implementing Omni and our recent employee survey highlighted that our employee net promoter score grew by double digits within a year.”

Download this resource and access it anytime, anywhere.


