


Summary. Leave data is one of the most underutilized tools in HR's attrition analysis toolkit. Patterns in how employees take time off, such as hoarding annual leave, clustering sick days around weekends, or surging in personal leave before bonus payouts, are reliable early warnings of voluntary exits. As Omni's Employee Attrition Report 2026 shows, attrition in the workplace rarely happens without warning; employees who take unpaid leave are more than 2x more likely to exit than those who don't. But spotting flight risk isn't just about how much leave someone takes. It's about the type, cadence, and timing, and knowing how to distinguish a one-off event from a meaningful behavioral shift. Cross-referenced with engagement scores and compensation stagnancy, leave data becomes one of the most powerful signals HR has — if they know how to act on it before the resignation letter lands.
For most HR teams, leave management is filed under the "administrative task" label. It is a process of checking balances, approving requests, and ensuring the payroll run is accurate. But if you’re only looking at leave data as a record of who is out of the office today, you are sitting on one of the most valuable early-warning datasets in your organization.
As shown in Omni’s Employee Attrition Report 2026, by the time an employee hands in their resignation, they have likely been disengaged for weeks, if not months. While headcount reports and exit interviews are lagging indicators—telling you what has already happened—leave data is a leading indicator. It reveals behavioral shifts in real-time, long before a formal notice is filed.
In a talent market as dynamic as Asia’s, waiting for the resignation letter is a high-stakes gamble, one many organizations can’t afford to take. This guide will teach you how to conduct a sophisticated attrition analysis using leave patterns to identify flight risks early and intervene before attrition in the workplace spikes.
Why Leave Data Predicts Attrition (Not Just Absence)
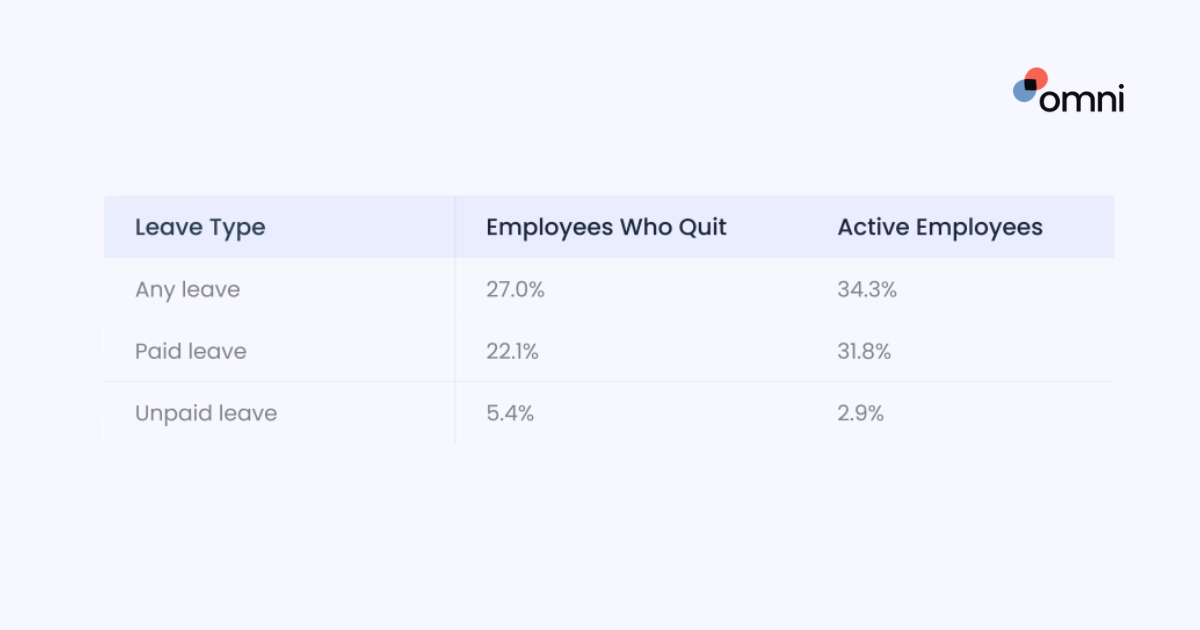
Why is leave so predictive? Because work-life balance is rarely static. When an employee’s relationship with their work changes, their "consumption" of time off changes too. For example, as we found in the Employee Attrition Report 2026, employees who take unpaid leave are more than 2x more likely to exit than employees who don’t. Leave is one of the few areas where employees have significant control over their schedules; therefore, it is a strong indicator of their commitment to the role.
Disengaged employees, or those actively job hunting, often show behavioral shifts in their leave records. Attrition analysis reveals it’s not just about how much leave they take, but the type, cadence, and timing of that leave.
Types of leave to track for attrition analysis:
- Annual leave: Specifically, look for total cessation of usage (hoarding leave) or sudden, uncharacteristic surges.
- Sick leave: Particularly frequent, short-term absences that lack a clear medical diagnosis.
- Unpaid leave: High usage of unpaid leave often signals that the employee no longer values the financial stability of the role and is mentally preparing to exit.
- Partial-day absences: Frequent "appointments" that happen during core working hours, which often serve as windows for interviews.
- Leave clustering: Patterns that consistently create three-day or four-day weekends (Monday/Friday clusters), suggesting a desire to disconnect from the workplace as much as possible.
The key to a successful attrition analysis is to distinguish between one-off leave events (a pre-planned vacation or a seasonal flu) and pattern shifts (a sudden change in how a long-tenured employee uses their time).
Red Flags in Leave Patterns
Based on extensive attrition analysis from our Employee Attrition Report 2026, we have identified four primary leave patterns that correlate most strongly with voluntary turnover in the Asian workplace.
Pattern 1: Sudden spike in unused annual leave
Counterintuitively, an employee who stops taking leave isn't always your most dedicated worker. Often, this is a sign of quiet quitting. When an employee no longer cares about their long-term sustainability at the company, they stop investing in the rest and recovery that annual leave provides.
Also, in many Asian jurisdictions where leave encashment is standard, employees who plan to resign will hoard their leave to ensure a larger final payout upon their exit.
- What to look for: A year-on-year comparison of leave utilization. If a historically consistent leave-taker has taken zero days in the last six months, it is a significant behavioral outlier.
- The signal: They are preparing for a clean break and want the cash value of their time.
Pattern 2: Short, frequent sick leave clusters
Frequent one- or two-day sick leave requests (especially when they consistently fall on a Monday or Friday) are classic indicators of burnout or avoidance behavior. In many cases, these "sick days" are not for physical ailments but are being used as "mental health days" to recover from a toxic environment or as windows for external interviews.
- What to look for: Track the frequency of single-day sick leave by the employee. If an employee’s frequency is 30% higher than their team average, or if the sick leave is consistently clustered around weekends, it is a flight risk signal.
- The signal: Avoidance of the workplace or active searching for a new role.
Pattern 3: Surge in leave requests before typical resignation windows
Attrition analysis reveals resignations in Asia often cluster around specific cultural and organizational milestones: performance review cycles, 13th-month bonus payouts, or the end of probation periods. An uptick in leave—particularly "personal leave" or "urgent leave"—in the 30 to 45 days leading up to these milestones is a major red flag.
- What to look for: Overlay your leave data with your organizational calendar. Are employees taking personal days the week after bonus discussions? This is often the period when they are finalizing offers from competitors.
- The signal: They are mentally checked out and waiting for the check to clear before leaving.
Pattern 4: Leave concentration in one team or under one manager
If leave rates are stable across 90% of the organization but skyrocketing in one specific department, you don't have an attrition problem; you have a management problem. High leave rates under a specific manager often signal localized issues like poor leadership, excessive workload, or a lack of psychological safety. Employees take more leave when they feel they cannot face their immediate superior.
- What to look for: Filter your attrition analysis by manager and department. Compare the team’s average leave rate against the company-wide baseline.
- The signal: Localized burnout or a "toxic boss" environment.
Leave patterns are one of several leading indicators that Omni tracked across companies in Asia. Download the Employee Attrition Report 2026 to see the full picture of what precedes voluntary exits — and how your organisation compares.
Process for Analyzing Your Leave Data
To move from administrative tracking to predictive attrition analysis, HR professionals should follow this structured process every quarter.
Step 1: Pull a rolling 12-month view of leave data
Point-in-time snapshots (looking only at last month) are useless for attrition analysis because they don't show the story of the data. You need a rolling 12-month report to see how behavior evolves.
Segment your data by:
- Leave type: Are they switching from Annual to Sick leave?
- Department/manager: Is the risk centralized?
- Tenure: New hires (0-6 months) taking high leave may indicate a "bad hire" or poor onboarding, while 2-year veterans taking high leave indicate burnout.
- Employment level: Are your middle managers the ones taking the most leave?
Step 2: Establish a baseline
Every company culture has a different normal. In a high-growth scale-up, the average leave utilization might be lower than in a legacy government-linked corporation. You must identify what "healthy" looks like in your organization before you can flag anomalies.
- Calculation: Total days taken / Total eligible days = Utilization Rate.
- Frequency: Total leave instances / Total headcount = Average Frequency.
Step 3: Flag outliers and trend shifts
Look for employees or teams that deviate more than 20–30% from their own historical baseline. Remember: the direction of the trend matters more than the absolute number.
- Case example: An employee who has always taken 20 days of leave per year isn't a risk; that is their baseline. An employee who usually takes 20 days but has suddenly taken only 2 days in the last 8 months is the one to watch.
Step 4: Cross-reference with other signals
Leave data is most powerful when layered with other data points. In the Omni 2026 Attrition Report, we found that a strong flight risk profile consisted of:
- A significant shift in leave behavior (clustering or cessation).
- Declining engagement scores in pulse surveys (specifically in the "Growth" and "Management" categories).
- Length of time since the last promotion or salary adjustment (stagnancy).
Our Employee Attrition Report 2026 shows that flight risk is most visible when multiple signals converge, particularly changes in leave behavior, organizational instability (e.g., manager changes), and gaps in compensation progression.
From Analysis to Action
Data without action is just trivia. Once your attrition analysis flags a risk, HR must act with empathy and precision. The goal is not to catch the employee, but to save them.
Individual risk flags
If an employee’s leave pattern shifts significantly, do not approach it as a disciplinary conversation. Instead, trigger a structured Stay Interview. Suggested questions for HR/Managers:
- "I noticed you haven't taken much time off lately. Is there anything we can do to help you recharge?"
- "Looking at the last quarter, how do you feel about your current workload and support system?"
- "Is there anything about your role or our team culture that makes you feel like you need to step away more often?"
Team-level flags
If a manager’s team shows a leave anomaly, escalate the data to that manager with a framework for interpretation. Often, managers are too close to the daily work to see the behavioral patterns. Give them the data to help them realize their team is at a breaking point.
- Action: Conduct a "team health check" to see if workloads are distributed fairly.
Org-level flags
If you see recurring patterns across multiple departments (e.g., everyone taking sick leave on Mondays), it indicates a systemic issue. This may require leadership-level action on compensation competitiveness, growth pathways, or the introduction of flexible work arrangements to address overall burnout.
- Cadence: Attrition analysis shouldn't be a one-off exercise; build it into quarterly HR reviews alongside engagement and headcount data
Analysing leave data is one piece of the puzzle. To understand the full range of attrition warning signs and what the data says about why employees in Asia are leaving in 2026, download Omni's 2026 Employee Attrition Report.
Make Leave Analysis Easier with Omni HR
Attrition analysis is only as good as the systems behind it. If your leave data is stored in disconnected spreadsheets, or if managers only learn about patterns during quarterly reviews, the window for intervention has already closed.
Omni gives HR teams the infrastructure to move from reactive record-keeping to predictive people strategy:
- Leave management & reporting: Centralise all leave data in one place and filter by type, team, tenure, and manager — no spreadsheet gymnastics required.
- Attrition analytics: Cross-reference leave data with headcount and engagement signals within our reports and analytics module to surface flight risk before it becomes a resignation.
- Manager visibility: Give people managers real-time visibility into their team's leave patterns so early signals don't get buried between HR review cycles.
- Automated alerts: Set thresholds so HR is notified the moment individual or team-level behavior shifts beyond a defined baseline — not weeks later.
The patterns are there. The question is whether your tools let you see them in time.
Book a demo to see how Omni helps you turn leave data into your earliest warning system for attrition.
For most HR teams, leave management is filed under the "administrative task" label. It is a process of checking balances, approving requests, and ensuring the payroll run is accurate. But if you’re only looking at leave data as a record of who is out of the office today, you are sitting on one of the most valuable early-warning datasets in your organization.
As shown in Omni’s Employee Attrition Report 2026, by the time an employee hands in their resignation, they have likely been disengaged for weeks, if not months. While headcount reports and exit interviews are lagging indicators—telling you what has already happened—leave data is a leading indicator. It reveals behavioral shifts in real-time, long before a formal notice is filed.
In a talent market as dynamic as Asia’s, waiting for the resignation letter is a high-stakes gamble, one many organizations can’t afford to take. This guide will teach you how to conduct a sophisticated attrition analysis using leave patterns to identify flight risks early and intervene before attrition in the workplace spikes.
Why Leave Data Predicts Attrition (Not Just Absence)
Why is leave so predictive? Because work-life balance is rarely static. When an employee’s relationship with their work changes, their "consumption" of time off changes too. For example, as we found in the Employee Attrition Report 2026, employees who take unpaid leave are more than 2x more likely to exit than employees who don’t. Leave is one of the few areas where employees have significant control over their schedules; therefore, it is a strong indicator of their commitment to the role.
Disengaged employees, or those actively job hunting, often show behavioral shifts in their leave records. Attrition analysis reveals it’s not just about how much leave they take, but the type, cadence, and timing of that leave.
Types of leave to track for attrition analysis:
- Annual leave: Specifically, look for total cessation of usage (hoarding leave) or sudden, uncharacteristic surges.
- Sick leave: Particularly frequent, short-term absences that lack a clear medical diagnosis.
- Unpaid leave: High usage of unpaid leave often signals that the employee no longer values the financial stability of the role and is mentally preparing to exit.
- Partial-day absences: Frequent "appointments" that happen during core working hours, which often serve as windows for interviews.
- Leave clustering: Patterns that consistently create three-day or four-day weekends (Monday/Friday clusters), suggesting a desire to disconnect from the workplace as much as possible.
The key to a successful attrition analysis is to distinguish between one-off leave events (a pre-planned vacation or a seasonal flu) and pattern shifts (a sudden change in how a long-tenured employee uses their time).
Red Flags in Leave Patterns
Based on extensive attrition analysis from our Employee Attrition Report 2026, we have identified four primary leave patterns that correlate most strongly with voluntary turnover in the Asian workplace.
Pattern 1: Sudden spike in unused annual leave
Counterintuitively, an employee who stops taking leave isn't always your most dedicated worker. Often, this is a sign of quiet quitting. When an employee no longer cares about their long-term sustainability at the company, they stop investing in the rest and recovery that annual leave provides.
Also, in many Asian jurisdictions where leave encashment is standard, employees who plan to resign will hoard their leave to ensure a larger final payout upon their exit.
- What to look for: A year-on-year comparison of leave utilization. If a historically consistent leave-taker has taken zero days in the last six months, it is a significant behavioral outlier.
- The signal: They are preparing for a clean break and want the cash value of their time.
Pattern 2: Short, frequent sick leave clusters
Frequent one- or two-day sick leave requests (especially when they consistently fall on a Monday or Friday) are classic indicators of burnout or avoidance behavior. In many cases, these "sick days" are not for physical ailments but are being used as "mental health days" to recover from a toxic environment or as windows for external interviews.
- What to look for: Track the frequency of single-day sick leave by the employee. If an employee’s frequency is 30% higher than their team average, or if the sick leave is consistently clustered around weekends, it is a flight risk signal.
- The signal: Avoidance of the workplace or active searching for a new role.
Pattern 3: Surge in leave requests before typical resignation windows
Attrition analysis reveals resignations in Asia often cluster around specific cultural and organizational milestones: performance review cycles, 13th-month bonus payouts, or the end of probation periods. An uptick in leave—particularly "personal leave" or "urgent leave"—in the 30 to 45 days leading up to these milestones is a major red flag.
- What to look for: Overlay your leave data with your organizational calendar. Are employees taking personal days the week after bonus discussions? This is often the period when they are finalizing offers from competitors.
- The signal: They are mentally checked out and waiting for the check to clear before leaving.
Pattern 4: Leave concentration in one team or under one manager
If leave rates are stable across 90% of the organization but skyrocketing in one specific department, you don't have an attrition problem; you have a management problem. High leave rates under a specific manager often signal localized issues like poor leadership, excessive workload, or a lack of psychological safety. Employees take more leave when they feel they cannot face their immediate superior.
- What to look for: Filter your attrition analysis by manager and department. Compare the team’s average leave rate against the company-wide baseline.
- The signal: Localized burnout or a "toxic boss" environment.
Leave patterns are one of several leading indicators that Omni tracked across companies in Asia. Download the Employee Attrition Report 2026 to see the full picture of what precedes voluntary exits — and how your organisation compares.
Process for Analyzing Your Leave Data
To move from administrative tracking to predictive attrition analysis, HR professionals should follow this structured process every quarter.
Step 1: Pull a rolling 12-month view of leave data
Point-in-time snapshots (looking only at last month) are useless for attrition analysis because they don't show the story of the data. You need a rolling 12-month report to see how behavior evolves.
Segment your data by:
- Leave type: Are they switching from Annual to Sick leave?
- Department/manager: Is the risk centralized?
- Tenure: New hires (0-6 months) taking high leave may indicate a "bad hire" or poor onboarding, while 2-year veterans taking high leave indicate burnout.
- Employment level: Are your middle managers the ones taking the most leave?
Step 2: Establish a baseline
Every company culture has a different normal. In a high-growth scale-up, the average leave utilization might be lower than in a legacy government-linked corporation. You must identify what "healthy" looks like in your organization before you can flag anomalies.
- Calculation: Total days taken / Total eligible days = Utilization Rate.
- Frequency: Total leave instances / Total headcount = Average Frequency.
Step 3: Flag outliers and trend shifts
Look for employees or teams that deviate more than 20–30% from their own historical baseline. Remember: the direction of the trend matters more than the absolute number.
- Case example: An employee who has always taken 20 days of leave per year isn't a risk; that is their baseline. An employee who usually takes 20 days but has suddenly taken only 2 days in the last 8 months is the one to watch.
Step 4: Cross-reference with other signals
Leave data is most powerful when layered with other data points. In the Omni 2026 Attrition Report, we found that a strong flight risk profile consisted of:
- A significant shift in leave behavior (clustering or cessation).
- Declining engagement scores in pulse surveys (specifically in the "Growth" and "Management" categories).
- Length of time since the last promotion or salary adjustment (stagnancy).
Our Employee Attrition Report 2026 shows that flight risk is most visible when multiple signals converge, particularly changes in leave behavior, organizational instability (e.g., manager changes), and gaps in compensation progression.
From Analysis to Action
Data without action is just trivia. Once your attrition analysis flags a risk, HR must act with empathy and precision. The goal is not to catch the employee, but to save them.
Individual risk flags
If an employee’s leave pattern shifts significantly, do not approach it as a disciplinary conversation. Instead, trigger a structured Stay Interview. Suggested questions for HR/Managers:
- "I noticed you haven't taken much time off lately. Is there anything we can do to help you recharge?"
- "Looking at the last quarter, how do you feel about your current workload and support system?"
- "Is there anything about your role or our team culture that makes you feel like you need to step away more often?"
Team-level flags
If a manager’s team shows a leave anomaly, escalate the data to that manager with a framework for interpretation. Often, managers are too close to the daily work to see the behavioral patterns. Give them the data to help them realize their team is at a breaking point.
- Action: Conduct a "team health check" to see if workloads are distributed fairly.
Org-level flags
If you see recurring patterns across multiple departments (e.g., everyone taking sick leave on Mondays), it indicates a systemic issue. This may require leadership-level action on compensation competitiveness, growth pathways, or the introduction of flexible work arrangements to address overall burnout.
- Cadence: Attrition analysis shouldn't be a one-off exercise; build it into quarterly HR reviews alongside engagement and headcount data
Analysing leave data is one piece of the puzzle. To understand the full range of attrition warning signs and what the data says about why employees in Asia are leaving in 2026, download Omni's 2026 Employee Attrition Report.
Make Leave Analysis Easier with Omni HR
Attrition analysis is only as good as the systems behind it. If your leave data is stored in disconnected spreadsheets, or if managers only learn about patterns during quarterly reviews, the window for intervention has already closed.
Omni gives HR teams the infrastructure to move from reactive record-keeping to predictive people strategy:
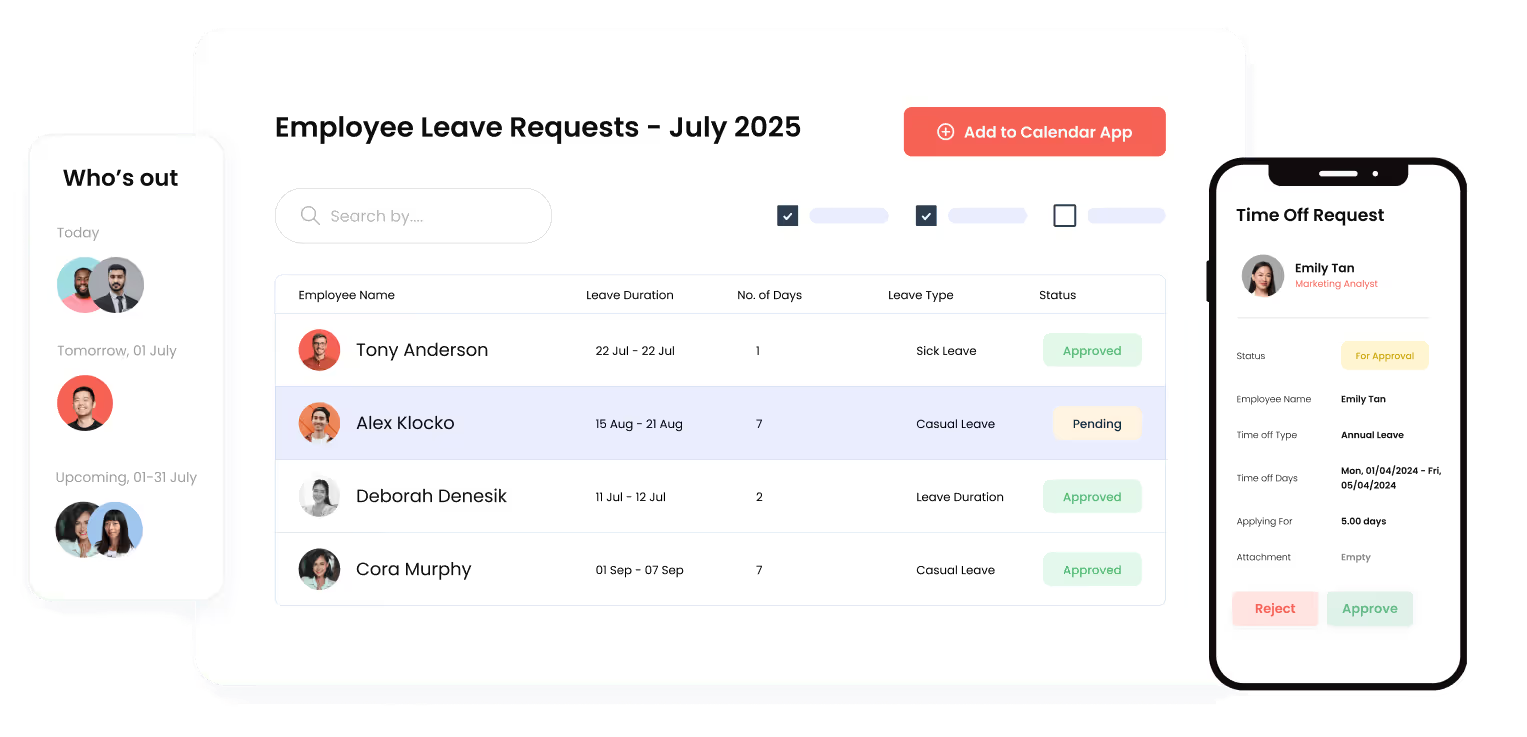
- Leave management & reporting: Centralise all leave data in one place and filter by type, team, tenure, and manager — no spreadsheet gymnastics required.
- Attrition analytics: Cross-reference leave data with headcount and engagement signals within our reports and analytics module to surface flight risk before it becomes a resignation.
- Manager visibility: Give people managers real-time visibility into their team's leave patterns so early signals don't get buried between HR review cycles.
- Automated alerts: Set thresholds so HR is notified the moment individual or team-level behavior shifts beyond a defined baseline — not weeks later.
The patterns are there. The question is whether your tools let you see them in time.
Book a demo to see how Omni helps you turn leave data into your earliest warning system for attrition.
Full HR & Payroll coverage for Philippines, Singapore, Malaysia, Hong Kong, and Indonesia. Each market has local support teams and built-in compliance features.
Starting at $3/employee/month for core features. Volume-based discounts are available for growing teams. Book a demo for custom pricing.
Enterprise-grade security with ISO 27001, GDPR certifications, and local data residency options.
4 weeks average. Includes free data migration, setup, and team training. No hidden fees.
Built specifically for Asia with local payroll processing, same-day support in Asia time zones, and 40% lower cost than global alternatives.

.avif)
.avif)
